



Reports
How to read a marketing report
Start at the money and work backward. Then ask one question of every number on the page: where did this come from?
Read a marketing report from the bottom up: start with booked jobs and revenue, then trace each one back to the lead and the dollar that brought it in. Then check every number for a label, because a measured number and a guess can look exactly the same on a chart.
Many reports are built the other way around. They open with impressions, clicks and reach, and the money comes last, if at all. Here's how to read one in 5 steps.
Step 1: Find the money line
A good report traces a straight line: spend → lead → job → revenue, by channel. In the OS, the ROI board shows exactly those columns: channel, spend, leads, jobs, revenue and ROAS (return on ad spend).
Here's a Sample month, with made-up numbers, to show how it reads:
- Ad spend: $1,500
- Calls and forms: 60
- Booked jobs: 18
- Revenue from those jobs: $9,000
So the cost per booked job is about $83 ($1,500 ÷ 18), and every $1 of ad spend brought back $6 in revenue ($9,000 ÷ $1,500). Those 2 numbers tell you more than any traffic chart. If your report can't produce them, that's the first thing to fix.
Step 2: Check the label on every number
Don't skip this step. Ask, for each figure: was it measured, worked out, or made up to show you the idea?
We label every number one of 3 ways:
- Real: measured from a source you connected, like your call tracking, your CRM or Search Console.
- Estimate: worked out from what we know, and labeled so.
- Sample: shown so you can see how it reads, never passed off as yours.
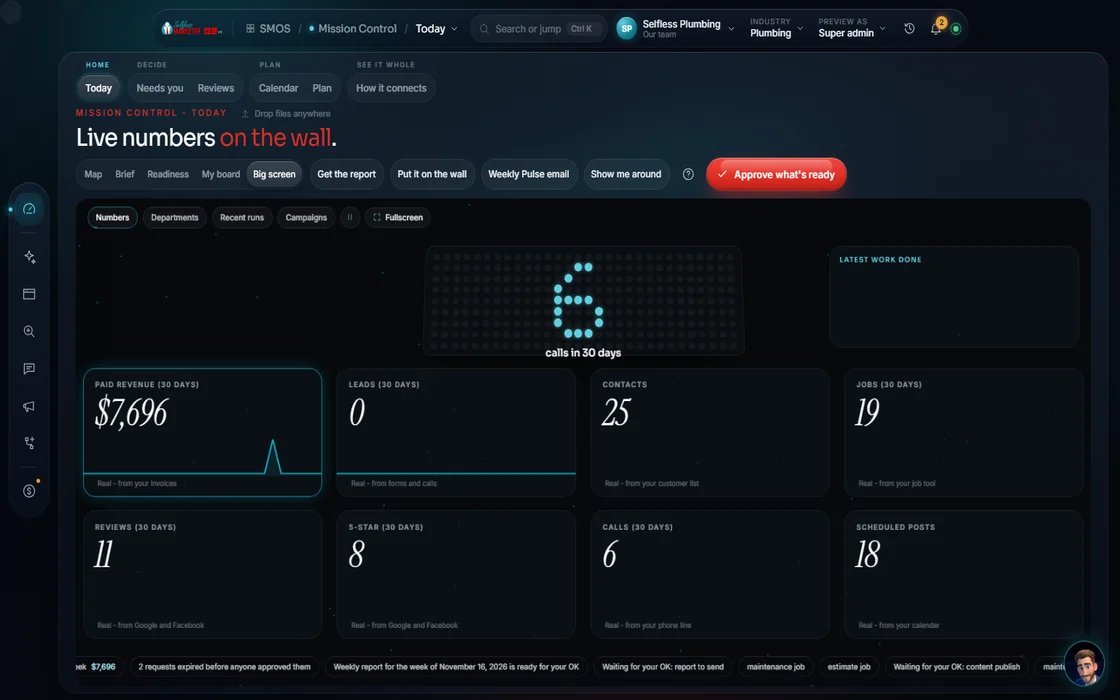
In the OS, nothing is shown as measured unless a real source is connected. A panel that isn't wired yet shows a "connect" prompt instead of a number. If your current report never tells you where a number came from, ask. It's a fair question.
Step 3: Read the calls, not just the count
"120 calls" sounds great. Then ask how many booked. The calls section should show:
- Which ad or page made the phone ring. Call tracking gives each site, ad and source its own number once your phone line is connected, so every call traces back to the campaign behind it.
- What happened on each call: booked, not booked, missed or voicemail.
- Cost per call and booked rate, side by side.
Call Intelligence logs the outcome of every call, and booked calls flow back into ROI as revenue. Why the call count alone can fool you is its own post: Lead quality vs call volume.
Step 4: Read the search section with care
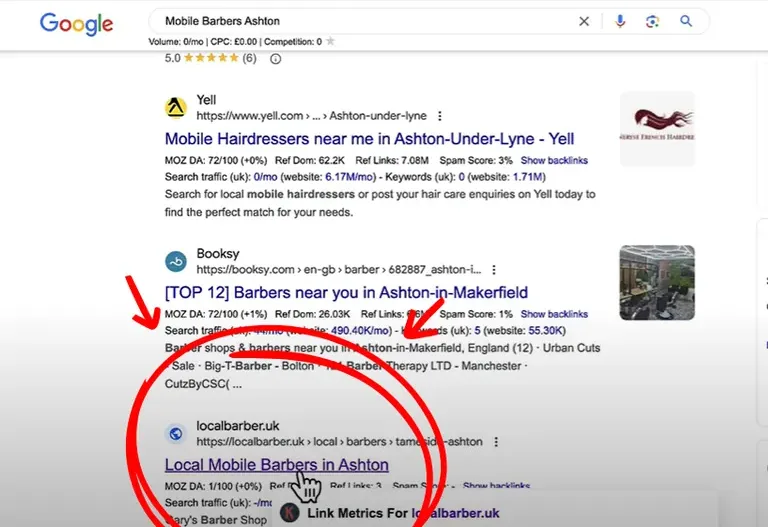
Rankings are worth tracking. They are not sales, and nobody can honestly promise you a spot. When you read the search part of a report, look for:
- Where the rank came from. In the OS, the rank of record comes from Google Search Console once it's connected, not from a screenshot.
- The whole service area, not 1 address. The local map grid shows where you show up on the map, point by point, across the area you serve.
- AI answers, measured. Share of AI answers per engine is tracked live once the data source (DataForSEO) is connected. Until then, it's labeled as not live.
Step 5: Read social for what it leads to
Followers and engagement do matter. Growth there is 1 of the 3 measures behind our Done-For-You Profit or Refund, next to quality leads and calls and actual revenue. But a social section should also show clicks that led somewhere. That takes UTM tags (a short label on each link that says where the click came from), so a Facebook click and a Google click don't blur together.
And a good report says what it can't see. Facebook reviews, for example, can't be pulled into any dashboard anymore, because Meta retired that door. An honest report says "unavailable". It doesn't show a zero.
Red flags on any report
- No revenue or booked jobs anywhere on it.
- Numbers with no source, or no way to ask for one.
- A different date range every month, so nothing lines up. Compare the same 7, 30 or 90 days each time.
- Lots of charts, no plain-English summary of what changed and what's next.
What ours look like
In the OS, reports are 1 click: the SEO reports, the Paid Ads spend and results report (your assistant drafts the summary from your real figures), and the ROI board. On Done-For-You, you get weekly reports by email, a monthly 1-hour call when you want it, and everything we do in your dashboard as we do it. Here's where we show you the receipts.
Not sure what your current numbers say? The Free Audit shows the gaps and errors costing you customers, and every row says whether it was measured or whether a person checks it on your call.
Quick answers
Questions owners ask
What's the 1 number I should look at first?
Cost per booked job, by channel. It ties spend to work that paid. Clicks and calls are only useful if they lead there.
How often should I get a report?
Done-For-You clients get one by email every week, plus a monthly 1-hour call as needed. In the OS, the dashboard is live whenever you open it, and reports run in 1 click.
Why do some of your numbers say Estimate?
Because the source isn't connected yet. Once your call tracking, CRM or Search Console is connected, the number switches to measured. We'd rather label it than pretend.
Keep going
Related pages
Free Audit
See what's costing you customers.
Ten sections, color-coded. The areas in red are the gaps and errors costing you visibility, and therefore, customers. About 60 seconds.

YOUR TEAM runs it with the OS, or OUR TEAM runs it for you with Done-For-You. Not sure? Which one fits me?